

Eastern Cape
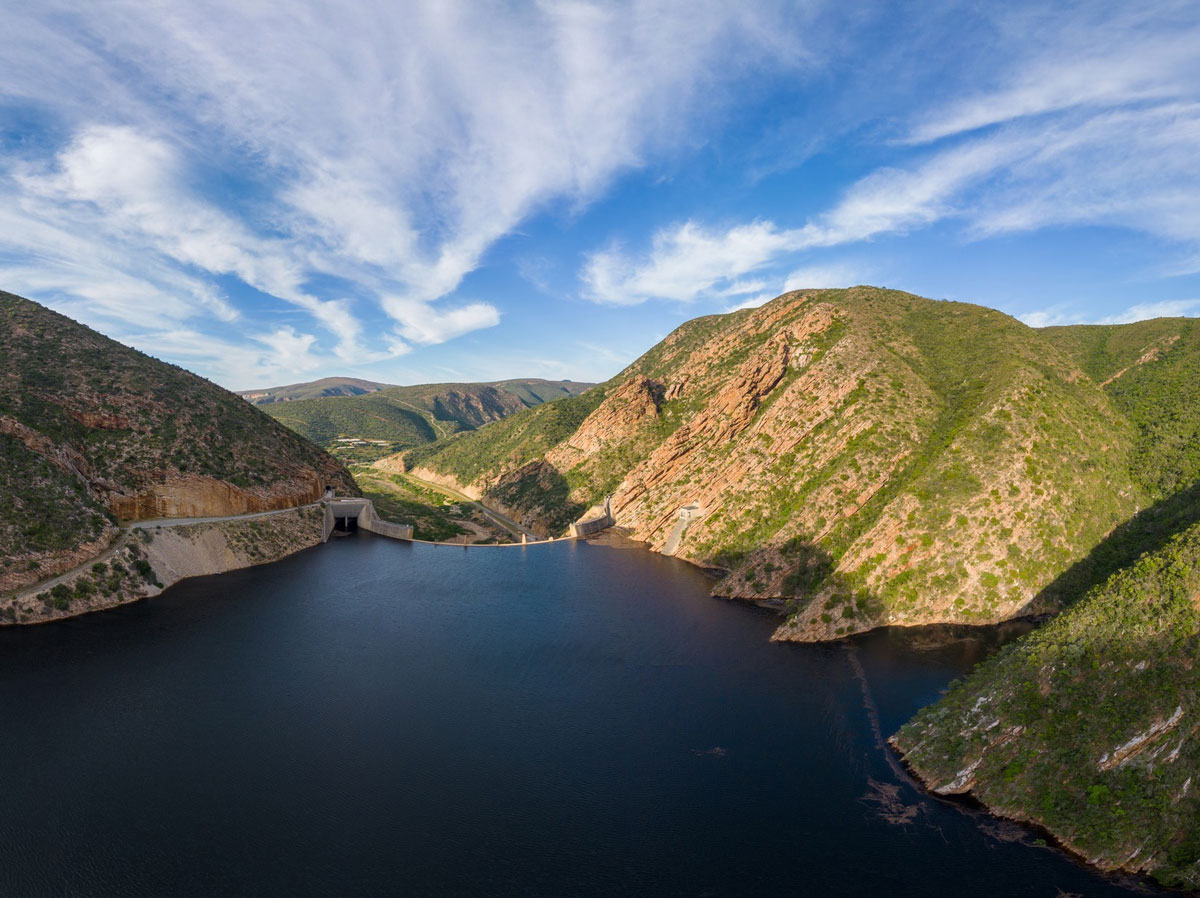
Photo: Kouga Dam (Kouga Municipality)
CLICK AD FOR MORE INFO
Compared to last year
Eastern Cape Total – 96.2%
Total at this time last year – 78.5%
Total at this time last year – 78.5%
Based on DWS data from 2026-10-05
# indicates latest available data
Belfort Dam
This week: 86.5% Last week: 86.5%
Last year: 100.0% (13.5% higher)
Capacity: 0.5 million cubic meters
Last year: 100.0% (13.5% higher)
Capacity: 0.5 million cubic meters
Binfield Dam
This week: 100.1% Last week: 100.1%
Last year: 96.1% (4% lower)
Capacity: 36.8 million cubic meters
Last year: 96.1% (4% lower)
Capacity: 36.8 million cubic meters
Boesmanskrantz Dam
This week: 69.2% Last week: 69.6%
Last year: 99.7% (30.5% higher)
Capacity: 4.9 million cubic meters
Last year: 99.7% (30.5% higher)
Capacity: 4.9 million cubic meters
Boesmanskrantz Dam
This week: 100.1% Last week: 100.2%
Last year: 99.4% (0.7% lower)
Capacity: 4.9 million cubic meters
Last year: 99.4% (0.7% lower)
Capacity: 4.9 million cubic meters
Bridle Drift Dam
This week: 106.2% Last week: 107.8%
Last year: 94.3% (11.9% lower)
Capacity: 98.0 million cubic meters
Last year: 94.3% (11.9% lower)
Capacity: 98.0 million cubic meters
Cata Dam
This week: 90.0% Last week: 85.6%
Last year: 90.2% (0.2% higher)
Capacity: 12.1 million cubic meters
Last year: 90.2% (0.2% higher)
Capacity: 12.1 million cubic meters
Corana Dam
This week: 99.3% Last week: 100.1%
Last year: 95.0% (4.3% lower)
Capacity: 0.8 million cubic meters
Last year: 95.0% (4.3% lower)
Capacity: 0.8 million cubic meters
Darlington Dam
This week: 59.6% Last week: 55.7%
Last year: 40.8% (18.8% lower)
Capacity: 179.9 million cubic meters
Last year: 40.8% (18.8% lower)
Capacity: 179.9 million cubic meters
De Mistkraal Dam
This week: 93.6% Last week: 102.9%
Last year: 74.3% (19.3% lower)
Capacity: 2.1 million cubic meters
Last year: 74.3% (19.3% lower)
Capacity: 2.1 million cubic meters
Debe Dam
This week: 92.1% Last week: 88.7%
Last year: 44.3% (47.8% lower)
Capacity: 6.4 million cubic meters
Last year: 44.3% (47.8% lower)
Capacity: 6.4 million cubic meters
Doornrivier Dam
This week: 101.2% Last week: 104.8%
Last year: 86.8% (14.4% lower)
Capacity: 17.1 million cubic meters
Last year: 86.8% (14.4% lower)
Capacity: 17.1 million cubic meters
Elands Drift Dam
This week: 54.9% Last week: 95.5%
Last year: 66.1% (11.2% higher)
Capacity: 3.6 million cubic meters
Last year: 66.1% (11.2% higher)
Capacity: 3.6 million cubic meters
Elandsdrift Dam
This week: 58.7% Last week: 102.3%
Last year: 51.0% (7.7% lower)
Capacity: 3.6 million cubic meters
Last year: 51.0% (7.7% lower)
Capacity: 3.6 million cubic meters
Glen Melville Dam
This week: 100.0% Last week: 98.3%
Last year: 79.6% (20.4% lower)
Capacity: 6.3 million cubic meters
Last year: 79.6% (20.4% lower)
Capacity: 6.3 million cubic meters
Glen Melville Dam
This week: 85.9% Last week: 90.8%
Last year: 90.8% (4.9% higher)
Capacity: 6.3 million cubic meters
Last year: 90.8% (4.9% higher)
Capacity: 6.3 million cubic meters
Grassridge Dam
This week: 94.2% Last week: 92.9%
Last year: 58.9% (35.3% lower)
Capacity: 44.5 million cubic meters
Last year: 58.9% (35.3% lower)
Capacity: 44.5 million cubic meters
Groendal Dam
This week: 103.4% Last week: 101.0%
Last year: 89.8% (13.6% lower)
Capacity: 11.7 million cubic meters
Last year: 89.8% (13.6% lower)
Capacity: 11.7 million cubic meters
Gubu Dam
This week: 100.6% Last week: 100.8%
Last year: 100.5% (0.1% lower)
Capacity: 8.6 million cubic meters
Last year: 100.5% (0.1% lower)
Capacity: 8.6 million cubic meters
Impofu Dam
This week: 101.0% Last week: 100.6%
Last year: 48.0% (53% lower)
Capacity: 105.8 million cubic meters
Last year: 48.0% (53% lower)
Capacity: 105.8 million cubic meters
Jozanashoek Dam
This week: 100.6% Last week: 101.1%
Last year: 98.5% (2.1% lower)
Capacity: 9.5 million cubic meters
Last year: 98.5% (2.1% lower)
Capacity: 9.5 million cubic meters
Katrivier Dam
This week: 100.6% Last week: 101.4%
Last year: 100.0% (0.6% lower)
Capacity: 24.9 million cubic meters
Last year: 100.0% (0.6% lower)
Capacity: 24.9 million cubic meters
Kommandodrift Dam
This week: 100.8% Last week: 101.9%
Last year: 80.8% (20% lower)
Capacity: 56.0 million cubic meters
Last year: 80.8% (20% lower)
Capacity: 56.0 million cubic meters
Kouga Dam
This week: 101.5% Last week: 100.5%
Last year: 67.9% (33.6% lower)
Capacity: 126.0 million cubic meters
Last year: 67.9% (33.6% lower)
Capacity: 126.0 million cubic meters
Kromrivier Dam
This week: 100.8% Last week: 100.6%
Last year: 69.7% (31.1% lower)
Capacity: 35.3 million cubic meters
Last year: 69.7% (31.1% lower)
Capacity: 35.3 million cubic meters
Laing Dam
This week: 101.1% Last week: 101.4%
Last year: 100.9% (0.2% lower)
Capacity: 19.0 million cubic meters
Last year: 100.9% (0.2% lower)
Capacity: 19.0 million cubic meters
Lake Arthur Dam
This week: 94.6% Last week: 65.5%
Last year: 25.4% (69.2% lower)
Capacity: 11.3 million cubic meters
Last year: 25.4% (69.2% lower)
Capacity: 11.3 million cubic meters
Loerie Dam
This week: 104.7% Last week: 101.7%
Last year: 75.1% (29.6% lower)
Capacity: 3.1 million cubic meters
Last year: 75.1% (29.6% lower)
Capacity: 3.1 million cubic meters
Lubisi Dam
This week: 98.3% Last week: 89.3%
Last year: 38.7% (59.6% lower)
Capacity: 113.6 million cubic meters
Last year: 38.7% (59.6% lower)
Capacity: 113.6 million cubic meters
Mabeleni Dam
This week: 100.0% Last week: 100.0%
Last year: 100.0% (the same)
Capacity: 2.1 million cubic meters
Last year: 100.0% (the same)
Capacity: 2.1 million cubic meters
Macubeni Dam
This week: 97.9% Last week: 99.6%
Last year: 98.7% (0.8% higher)
Capacity: 3.4 million cubic meters
Last year: 98.7% (0.8% higher)
Capacity: 3.4 million cubic meters
Macubeni Dam
This week: 102.6% Last week: 107.8%
Last year: 82.8% (19.8% lower)
Capacity: 1.2 million cubic meters
Last year: 82.8% (19.8% lower)
Capacity: 1.2 million cubic meters
Mlanga Dam
This week: 95.8% Last week: 96.0%
Last year: 85.3% (10.5% lower)
Capacity: 1.6 million cubic meters
Last year: 85.3% (10.5% lower)
Capacity: 1.6 million cubic meters
Mnyameni Dam
This week: 100.0% Last week: 100.0%
Last year: 99.9% (0.1% lower)
Capacity: 1.9 million cubic meters
Last year: 99.9% (0.1% lower)
Capacity: 1.9 million cubic meters
Nahoon Dam
This week: 100.4% Last week: 101.1%
Last year: 87.7% (12.7% lower)
Capacity: 19.3 million cubic meters
Last year: 87.7% (12.7% lower)
Capacity: 19.3 million cubic meters
Ncora Dam
This week: 101.5% Last week: 105.4%
Last year: 93.7% (7.8% lower)
Capacity: 144.9 million cubic meters
Last year: 93.7% (7.8% lower)
Capacity: 144.9 million cubic meters
Nqadu Dam
This week: 62.7% Last week: 61.9%
Last year: 85.9% (23.2% higher)
Capacity: 1.3 million cubic meters
Last year: 85.9% (23.2% higher)
Capacity: 1.3 million cubic meters
Nqweba Dam
This week: 105.3% Last week: 110.5%
Last year: 91.6% (13.7% lower)
Capacity: 45.4 million cubic meters
Last year: 91.6% (13.7% lower)
Capacity: 45.4 million cubic meters
Ntenetyana Dam
This week: 77.1% Last week: 67.9%
Last year: 90.4% (13.3% higher)
Capacity: 1.7 million cubic meters
Last year: 90.4% (13.3% higher)
Capacity: 1.7 million cubic meters
Nuwejaars Dam
This week: 101.7% Last week: 101.7%
Last year: 58.5% (43.2% lower)
Capacity: 4.6 million cubic meters
Last year: 58.5% (43.2% lower)
Capacity: 4.6 million cubic meters
Oxkraal Dam
This week: 100.6% Last week: 100.9%
Last year: 96.9% (3.7% lower)
Capacity: 15.2 million cubic meters
Last year: 96.9% (3.7% lower)
Capacity: 15.2 million cubic meters
Rooikrans Dam
This week: 100.2% Last week: 100.8%
Last year: 90.4% (9.8% lower)
Capacity: 4.8 million cubic meters
Last year: 90.4% (9.8% lower)
Capacity: 4.8 million cubic meters
Sandile Dam
This week: 100.5% Last week: 101.0%
Last year: 88.5% (12% lower)
Capacity: 29.7 million cubic meters
Last year: 88.5% (12% lower)
Capacity: 29.7 million cubic meters
Tsojana Dam
This week: 100.0% Last week: 100.0%
Last year: 99.9% (0.1% lower)
Capacity: 12.3 million cubic meters
Last year: 99.9% (0.1% lower)
Capacity: 12.3 million cubic meters
Mthatha Dam
This week: 101.2% Last week: 102.7%
Last year: 97.8% (3.4% lower)
Capacity: 244.7 million cubic meters
Last year: 97.8% (3.4% lower)
Capacity: 244.7 million cubic meters
Waterdown Dam
This week: 100.8% Last week: 102.2%
Last year: 100.4% (0.4% lower)
Capacity: 37.5 million cubic meters
Last year: 100.4% (0.4% lower)
Capacity: 37.5 million cubic meters
Wriggleswade Dam
This week: 100.4% Last week: 100.9%
Last year: 100.2% (0.2% lower)
Capacity: 91.5 million cubic meters
Last year: 100.2% (0.2% lower)
Capacity: 91.5 million cubic meters
Xonxa Dam
This week: 100.9% Last week: 103.5%
Last year: 97.5% (3.4% lower)
Capacity: 116.4 million cubic meters
Last year: 97.5% (3.4% lower)
Capacity: 116.4 million cubic meters
CLICK AD FOR MORE INFO
CLICK AD FOR MORE INFO
See Also